Lab 1: Introduction to Colorimetry
Background and Objectives
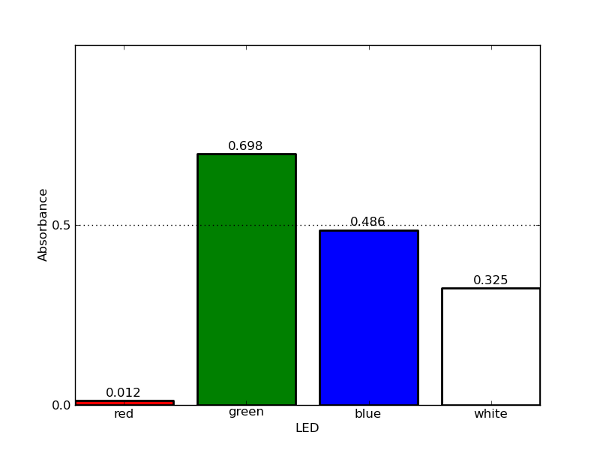
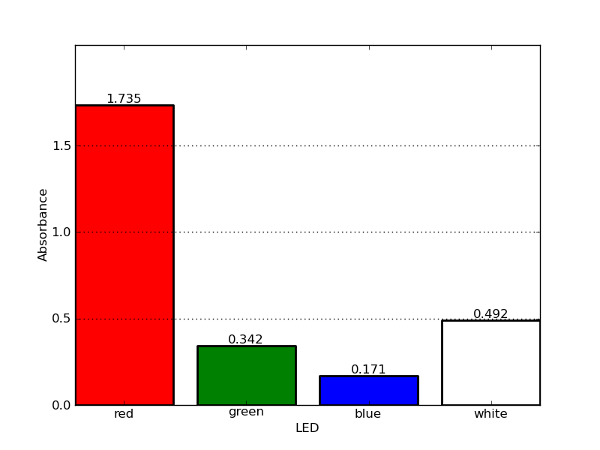
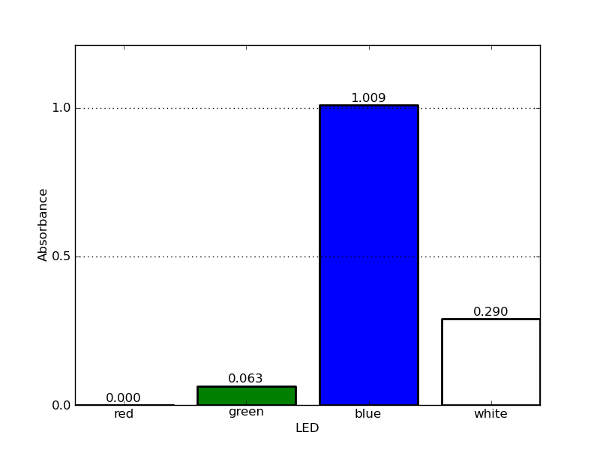
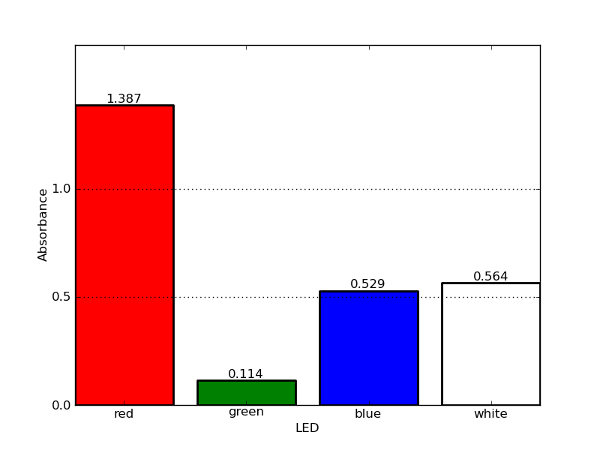
The visible light spectrum consists of a range of frequencies, each of which corresponds to a specific color. Any visible light that strikes an object and becomes reflected (or transmitted to our eyes) will contribute to the color appearance of that object. In the same way, the color of a solution is a direct result of the wavelengths of light absorbed by the solution. So, if a solution absorbs all of the frequencies of visible light except for the frequency associated with green light, then the object will appear green.
The objective of this lab is to investigate how different colored food dye solutions absorb different wavelengths of light.
Materials
- Assembled Colorimeter
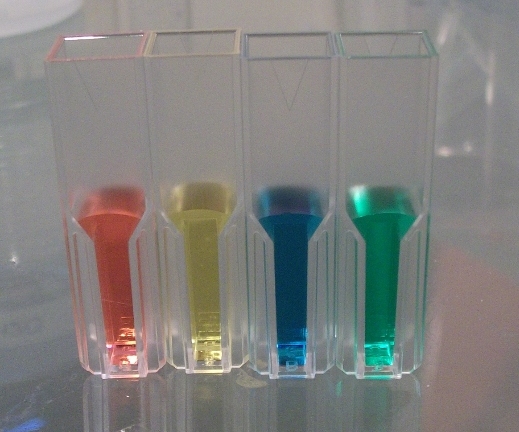
- Diluted food dyes - We have used FD&C red # 40, blue # 1 and yellow # 5 food dyes which can be found in most grocery stores. Dilute these dyes 10-fold before using in the lab. Note: The green food dye is a mixture of the blue and yellow dyes.
- 5 x cuvettes (part of the Educational Colorimeter kit)
- 1 mL fixed volume pipette
- Disposable plastic pipette e.g. Carolina Disposable Plastic Needle-Point Pipets, Cat # 214561
- Water
Methods
This lab uses the Educational Colorimeter Basic program.
- Fill five cuvettes with 1 mL of water;
- Add 1 drop of diluted food dye (approximately 10 µL) to individual cuvettes. This will yield one cuvette with red dye, one with blue, one with green, and one with yellow. One cuvette should be left with just water for calibration. Mix the solutions by pipetting them up and down several times;
- Launch the colorimeter basic program;
- Place the cuvette with water in the colorimeter and click on calibrate. The display should now read 0.00 Absorbance (and 1.00 Transmittance) across all 4 color channel readings;
- Place the cuvette with red dye in the colorimeter and click on measure. Ensure that all color channels (Red, Green, and Blue) are selected in the program. Save the plot for later use if required;
- Repeat for the yellow, blue and green food dyes.